Red-Zone Stats for TD Props: Efficiency Data That Drives Touchdown Probability
Table of Contents
- Red-Zone Data Is the Foundation of Every Sharp TD Prop Bet
- NFL Red-Zone TD Conversion Rates: Team-Level Analysis
- Red-Zone Target Share: Identifying the Primary Scoring Threats
- Goal-Line Rush Share and Its Correlation with Rushing TDs
- Defensive Red-Zone Efficiency: Targeting Weak Defences
- Applying Red-Zone Data to Weekly TD Prop Selections
- Frequently Asked Questions
Red-Zone Data Is the Foundation of Every Sharp TD Prop Bet
Early in my prop betting career, I spent most of my research time looking at total yards, targets, and carries. It felt thorough. It was also almost useless for predicting touchdowns. The breakthrough came when I started filtering everything through a single lens: what happens inside the 20-yard line? That shift — from total production to red-zone production — transformed my TD prop results more than any other analytical change I have made.
In the 2024 NFL season, 77.2% of all touchdowns were scored from inside the red zone. That was the second-highest figure recorded in 15 years, and the trend has been climbing for five consecutive seasons. The red zone is not just where touchdowns happen most often — it is increasingly where they happen almost exclusively. A player who racks up 120 receiving yards between the twenties but sees zero targets inside the 20 is a fantasy football asset, not a touchdown prop asset. Conversely, a running back with 40 total rushing yards who receives three carries inside the five-yard line has a meaningful chance of finding the end zone.
Red-zone usage — targets or rush attempts inside the 20 — is the most predictive single factor for touchdown probability, a principle that analytics platform Outlier.bet has emphasised as the foundation of sharp TD prop analysis. Combine red-zone target share with goal-line rush share for running backs, and you have the two metrics that explain more touchdown variance than any other combination of statistics available to the public.
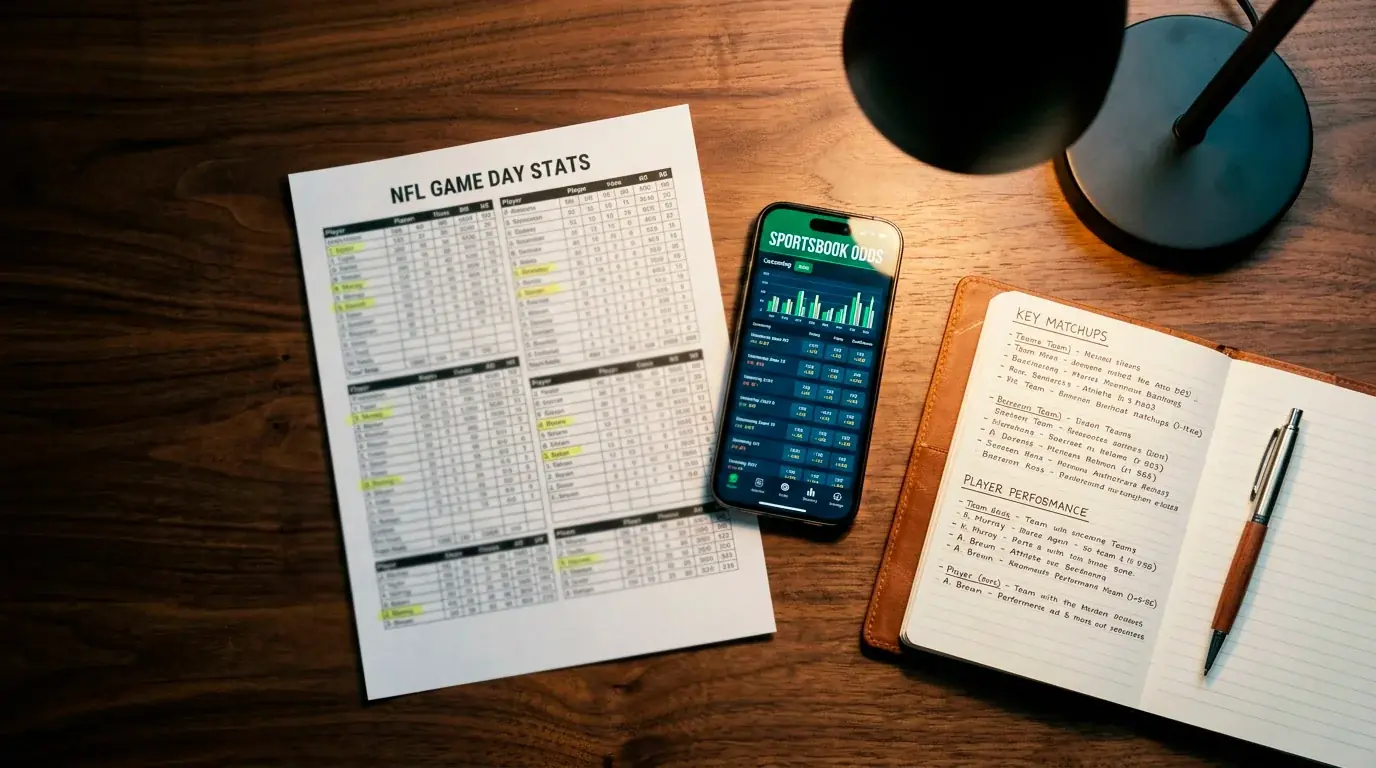
What surprises most punters I work with is how accessible this data is. You do not need a paid analytics subscription or a proprietary model. Free sources publish red-zone usage metrics weekly during the NFL season, and the analysis required to turn those numbers into actionable prop bets is arithmetic, not advanced statistics. This guide breaks down exactly how to source, interpret, and apply red-zone data to your weekly TD prop selections — the same process I have refined over seven seasons of betting this market from the UK.
NFL Red-Zone TD Conversion Rates: Team-Level Analysis
Not every trip inside the 20 produces a touchdown. Some end in field goals, some end in turnovers, and some end in failed fourth-down attempts. The rate at which a team converts red-zone possessions into touchdowns — rather than settling for three points — is the first data point I check every week.
In the 2025 season, the Philadelphia Eagles led the NFL with a 70.97% red-zone touchdown conversion rate. That number is remarkable: more than seven out of every ten times the Eagles entered the red zone, they scored a touchdown rather than a field goal. For a prop bettor, this means that any player who commands a significant share of Philadelphia’s red-zone usage carries an elevated baseline probability of scoring compared to a similar player on a less efficient offence.
At the other end of the spectrum, some offences are notoriously inefficient inside the 20. Teams that convert below 50% are effectively splitting their red-zone trips between touchdowns and field goals, which suppresses the touchdown probability for every individual player on that offence. Backing a player with strong usage on a red-zone-inefficient team is like having a fast car on a slow road — the individual talent matters less when the system around him fails to finish drives.
The Los Angeles Rams offered an interesting case study in 2025. They led the league in red-zone plus/minus at +141, generating 76 red-zone trips with a 63.2% conversion rate. What made them particularly useful for prop analysis was the distribution of those touchdowns: the Rams funnelled a high percentage of red-zone work through a small number of players, which made identifying the primary scoring threat straightforward. Teams that distribute red-zone touches more evenly across four or five players create diluted individual probabilities that are harder to exploit.
I maintain a simple spreadsheet that ranks all 32 teams by red-zone TD conversion rate, updated weekly. The ranking shifts throughout the season as injuries, scheme changes, and schedule difficulty alter team performance. A team that converts at 68% through Week 8 might drop to 58% after losing a starting offensive lineman or facing a stretch of elite defences. The rolling four-week window I use for player-level usage data also applies here: recent team-level red-zone efficiency is more predictive than season-long averages, especially past the midpoint of the year.
One pattern I have noticed over multiple seasons is that red-zone efficiency tends to cluster. The top five or six teams typically convert above 62%, the middle tier sits between 50% and 62%, and the bottom five or six convert below 50%. The gap between the top cluster and the bottom cluster is substantial — it can represent a 20-percentage-point difference in the likelihood of any individual red-zone trip producing a touchdown. When I evaluate players for TD props, I weight this team-level context heavily. A player with identical individual usage on a top-five offence and a bottom-five offence will have materially different touchdown probabilities, and my odds thresholds reflect that difference.
Red-Zone Target Share: Identifying the Primary Scoring Threats
Team-level conversion rates tell you how often the offence finishes drives. Red-zone target share tells you who finishes them. This is the player-level metric that separates useful analysis from guesswork.
Red-zone target share measures the percentage of a team’s total passing targets inside the 20-yard line that go to a specific receiver. A wide receiver with a 25% red-zone target share on a team that averages four red-zone passing targets per game is seeing one target per game in the area that produces 65% of all NFL touchdowns. That single target, combined with the team’s red-zone conversion rate and the opposing defence’s red-zone efficiency, gives you a quantifiable probability estimate that is far more reliable than overall receiving yards or total targets.
The players who show up repeatedly in my weekly shortlists share a common trait: they are their team’s primary red-zone receiving option, even if they are not the WR1 in terms of total yardage. A slot receiver who leads his team in red-zone targets despite ranking third in total receiving yards is a more attractive TD prop candidate than the team’s deep-threat WR1 who rarely sees targets inside the 20. The distinction is critical, and it is one that most casual bettors miss because they evaluate receivers by headline stats rather than situational usage.
Tight ends deserve special attention in this context. Red-zone-dependent tight ends — the kind who run seam routes, back-shoulder fades, and crossing patterns inside the 20 — often carry red-zone target shares of 18-22% while ranking modestly in total receiving production. Their anytime TD odds tend to be longer than similarly situated wide receivers because the public underestimates their scoring frequency. In my experience, the tight end position offers the most consistent pricing inefficiency in the anytime TD market, precisely because the public focuses on the flashier names at wide receiver.
I pull red-zone target data weekly, using a rolling four-game window. The four-game window captures recent usage trends without being so narrow that a single game distorts the picture. If a receiver’s red-zone target share jumps from 12% to 28% over a two-week stretch because a teammate was injured, the four-game window picks up that change faster than a season-long average would, and I can act on it before the sportsbooks fully adjust their odds.
Goal-Line Rush Share and Its Correlation with Rushing TDs
For running back TD props, the equivalent of red-zone target share is goal-line carry share — specifically, the percentage of a team’s rushing attempts inside the five-yard line that go to the player in question. This is the single strongest predictor of rushing touchdowns, and it is the metric I weight most heavily when evaluating any back for an anytime TD bet.
Jonathan Taylor led the NFL with 20 total touchdowns in the 2025 season. That number was not a fluke or a product of otherworldly talent alone — it was the predictable outcome of a player who received the dominant share of his team’s goal-line carries in an offence that reached the red zone frequently. Taylor’s case is the archetype: high goal-line carry share on a team with an above-average red-zone visit rate equals a high touchdown total. The maths is almost mechanical.
The complication arises with committee backfields. When a team splits carries near the goal line between two or three backs, each individual back’s rushing TD probability drops significantly. A team that gives its lead back 70% of goal-line carries concentrates the scoring opportunity. A team that splits 40/30/30 between three backs dilutes it to the point where none of them individually carries a strong enough probability to justify a bet at typical anytime TD odds.
I classify running back situations into three tiers. Tier one: bellcow backs with 60%+ goal-line carry share — these are my primary rushing TD targets. Tier two: lead backs with 40-60% share — viable in strong scoring environments against weak run defences, but requiring more selective odds to justify. Tier three: anything below 40% — I almost never bet these unless a specific game script factor (heavy favourite, expected to run out the clock) pushes the probability higher than the baseline suggests.
Game script is the hidden variable that can override even the most reliable goal-line carry data. A team leading by 17 points in the fourth quarter will run the ball on nearly every play, and those late-game carries often include goal-line work that inflates the lead back’s scoring probability beyond what pre-game data alone would suggest. Conversely, a team trailing badly will abandon the run entirely, stranding even a bellcow back without the touches he needs to score. I factor the Vegas spread into my running back analysis for this reason: heavy favourites are more likely to run the ball in positive game scripts, which correlates with higher rushing TD probability for their lead backs.
For a detailed examination of how goal-line carry data specifically predicts rushing touchdowns, including where to find inside-the-five carry statistics, I have written a separate analysis.
Defensive Red-Zone Efficiency: Targeting Weak Defences
Offensive usage tells you who is most likely to score on a given team. Defensive red-zone efficiency tells you which opponents are most likely to allow it. Combining both gives you a probability estimate with teeth.
The Denver Broncos stood alone in the 2025 season as the only NFL team that conceded fewer touchdowns than field goals inside the red zone, holding opponents to a 42.6% TD conversion rate. For a prop bettor, Denver’s defensive profile served as a clear warning sign: even a high-usage player facing the Broncos carried a suppressed touchdown probability because Denver’s ability to force field goals inside the 20 was exceptional.
On the opposite end, bottom-five red-zone defences — those allowing TD conversion rates above 65% — create inflated scoring opportunities for opposing offences. When I cross-reference a player’s red-zone usage with the opposing defence’s red-zone efficiency, the delta between facing a top-five and a bottom-five defence can shift a player’s estimated touchdown probability by 8-12 percentage points. That swing is often larger than the sportsbook’s margin, which means defensive matchup data alone can flip a bet from -EV to +EV or vice versa.
I track defensive red-zone metrics in two layers. The first is overall red-zone TD rate allowed, which captures how often defences surrender touchdowns versus field goals inside the 20. The second is a split between passing TD rate and rushing TD rate allowed in the red zone. Some defences are stout against the run near the goal line but vulnerable to passing touchdowns on fade routes and crossing patterns. Others collapse against power running in short-yardage situations but lock down in the secondary. Knowing which side of the defence is weaker tells me whether to focus on a receiving TD candidate or a rushing TD candidate for a given matchup.
The weekly habit is simple: rank the 32 defences by red-zone TD rate allowed, identify the bottom 10, and cross-reference with the offensive players I have already shortlisted. If a running back with a 65% goal-line carry share faces a defence in the bottom five for rushing TD rate allowed in the red zone, the convergence of factors is strong enough to warrant a bet at fair odds. If that same back faces Denver, I walk away.
There is one nuance worth highlighting: defensive red-zone efficiency is more volatile than offensive efficiency over short stretches. A defence that ranks fifth in red-zone TD rate allowed through Week 10 might drop to 15th after losing a key interior defender to injury. I pay close attention to defensive injury reports — specifically losses along the defensive line and at linebacker for run defence, and at cornerback and safety for pass defence. A secondary missing its CB1 is dramatically more vulnerable to red-zone passing touchdowns, which creates immediate value for opposing receivers who meet the target share threshold.
Tracking defensive splits by down and distance inside the red zone is an advanced step that has paid off for me in specific situations. Some defences are excellent on first and second down in the red zone but collapse on third and goal. Others are strong in pass coverage but consistently allow rushing touchdowns on short-yardage plays. These granular splits require more digging to find, but they are available on advanced stats platforms, and they refine the defensive matchup analysis from a broad “good defence vs bad defence” assessment into a targeted “weak against the specific type of scoring play I am betting on” evaluation.
Applying Red-Zone Data to Weekly TD Prop Selections
Data without application is just trivia. The value of everything in this guide comes from turning red-zone numbers into a weekly decision process that filters noise and surfaces the three or four bets worth placing. Here is how I stitch it together each week.
I start with a matrix — a simple grid with one row per game and columns for offensive red-zone conversion rate, defensive red-zone TD rate allowed, game total, and a notes column for injuries or weather. Games where the offensive conversion rate sits above 55% and the defensive TD rate allowed sits above 60% get highlighted. These are the matchups where touchdown volume is most likely to be elevated on at least one side of the ball. In a typical 16-game NFL Sunday slate, four to six games meet this threshold.
Within those highlighted games, I pull individual player usage. Red-zone target share for receivers and tight ends, goal-line carry share for running backs. Any player above my minimum thresholds — 15% red-zone target share for receivers, 40% goal-line carry share for backs — gets added to a shortlist. By this point, the shortlist usually contains eight to twelve names.
The next filter is odds-based. I check each shortlisted player’s anytime TD odds across three or more UKGC-licensed sportsbooks, convert to implied probability, strip the estimated margin, and compare against my own probability estimate built from the red-zone data. If my estimate exceeds the margin-free implied probability by at least 5%, the player qualifies for a bet. If the gap is smaller than 5%, I pass — the edge is not large enough to overcome the inherent variance of a market where even the strongest candidates lose 60% or more of the time.
One practical tip that has saved me from chasing phantom edges: I re-check the data on Saturday evening, after the final injury designations are released. A starting receiver ruled out on Saturday afternoon can shift red-zone target share dramatically for his teammates, creating value that did not exist when I ran my Wednesday analysis. Conversely, a player I shortlisted on Wednesday might lose value if a teammate returns from injury and reclaims a share of the red-zone work. The Saturday re-check adds 20 minutes to the process and catches adjustments that the sportsbooks may not fully price in until Sunday morning.
The entire system is designed to be mechanical. Every step has a defined threshold, and every threshold is based on data rather than intuition. That does not mean I never exercise judgement — context matters, and a number on a spreadsheet cannot capture every nuance of a football game. But the framework ensures that judgement is applied after the data has narrowed the field, not before. Gut feelings get a vote, not a veto.
Frequently Asked Questions
Where can I find free red-zone stats for NFL teams and players?
Several free platforms publish red-zone data during the NFL season. Pro Football Reference provides team-level red-zone conversion rates, and NFL.com’s own statistics section includes red-zone scoring breakdowns by team. For player-level red-zone target share and carry data, advanced stats sites publish weekly updates that include inside-the-20 usage metrics. I cross-reference at least two sources each week to verify the numbers before building my shortlist.
How often do red-zone targets change during an NFL season?
More often than most punters expect. Injuries are the primary driver — when a team’s WR1 misses a game, his red-zone targets redistribute across the remaining receivers, sometimes dramatically. Scheme changes, trades, and bye weeks also shift the distribution. I use a rolling four-game window precisely because usage patterns can shift materially in a two-week span, and a season-long average masks those shifts.
Does red-zone efficiency predict touchdowns better than total yardage?
Substantially better. Total yardage measures a player’s value across the entire field, but touchdowns are concentrated inside the 20-yard line. A receiver with 900 yards and 2 touchdowns is likely generating most of his production between the twenties. A receiver with 600 yards and 8 touchdowns is concentrated in the red zone. For TD prop betting, the second player is far more relevant, and red-zone usage data captures that distinction where total yardage does not.
How should I weight offensive vs defensive red-zone stats in TD prop analysis?
I treat them as equally important inputs in different parts of the analysis. Offensive red-zone conversion rate tells me how likely a team is to score touchdowns when they reach the 20. Defensive red-zone TD rate allowed tells me how vulnerable the opponent is to surrendering touchdowns in that area. The combination of the two — a high-converting offence facing a defence that allows a high TD rate in the red zone — produces the strongest scoring environments for individual player props.
Published by the nfl td Prop Bets team.