
NFL TD Prop Bet Tracker: Free Spreadsheet for Results Logging
 Available in US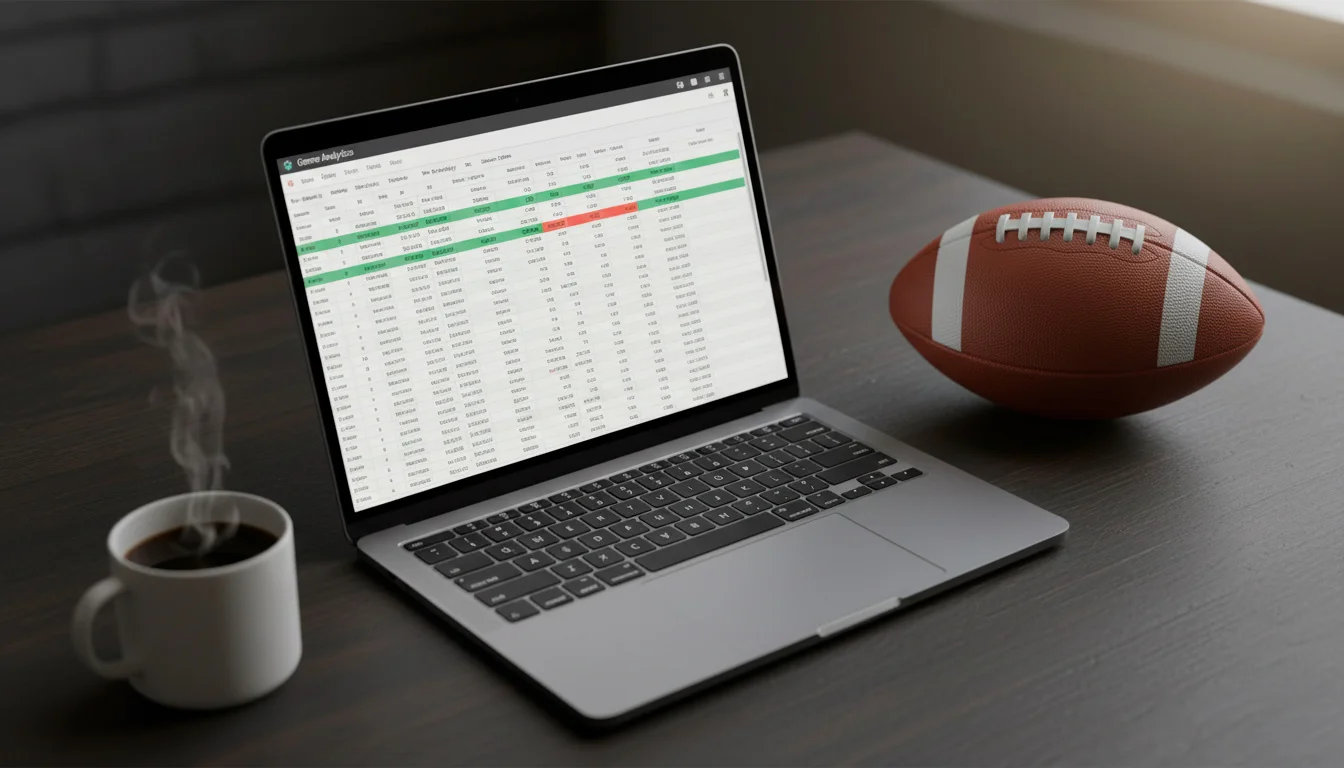
Prop Bet Tracking: Logging CLV and ROI for Performance Analysis
In my second season of TD prop analysis, I kept mental notes of my bets. I remembered the wins vividly and forgot most of the losses. By December, I was convinced I was profitable. When I finally sat down and reconstructed every bet from my sportsbook transaction history, I discovered I was down 6.2 units. The selective memory that afflicts every bettor had created a fantasy version of my results that bore no resemblance to reality. I built my tracking spreadsheet that night and have logged every bet since.
The 64% of NFL bettors who wager weekly generate hundreds of individual transactions over a season. Without a systematic record, patterns that could improve your process — which prop types are profitable, which matchup conditions produce winners, where your analysis breaks down — remain invisible. A tracking spreadsheet is not optional overhead; it is the analytical backbone that makes every other aspect of your TD prop strategy improvable.
Essential Fields for a TD Prop Bet Tracking Spreadsheet
The template I use contains fourteen columns, and every one of them earns its place through demonstrated utility in post-season review. Removing any single field reduces your ability to identify actionable patterns.
The first group captures the bet itself: date placed, NFL week number, player name, team, opponent, prop type (anytime TD, first TD, 2+ TD), odds at time of bet (in decimal format), stake in units, and sportsbook used. These nine fields describe what you bet, when, and where.
The second group captures results: outcome (win, loss, void), profit or loss in units, and closing odds at kickoff. Closing odds are critical because they enable closing line value calculation — the metric that tells you whether you are consistently beating the market rather than merely getting lucky.
The third group provides analytical context: a matchup note field (one or two sentences explaining why you selected this bet) and a red-zone data field (the player’s red-zone target share or goal-line carry share at the time of the bet). These contextual fields transform your spreadsheet from a transaction log into a decision journal. When you review your season, the matchup notes tell you which analytical reasoning produced winners and which produced losers, allowing you to refine the process itself rather than just observing the results.
I format the spreadsheet with conditional colour coding: green for winning bets, red for losses, and yellow for voids. The visual pattern this creates over a full season is itself informative — you can see at a glance whether your wins are clustered around certain weeks, prop types, or sportsbooks.
One field I considered adding but deliberately excluded is a confidence rating. Early in my tracking history, I rated each bet on a one-to-five confidence scale. Over two seasons, I found zero correlation between my pre-bet confidence and actual outcomes. The confidence rating was measuring my emotional state rather than the bet’s quality, and it introduced a bias toward remembering high-confidence losses as bad luck rather than flawed analysis. If you want to experiment with confidence ratings, track them for a full season and test the correlation before relying on them for stake sizing.
Calculated Columns: ROI, Yield, CLV, and Implied Edge
Raw data becomes actionable through calculated columns that transform individual bet records into performance metrics. I maintain four calculated columns that update automatically as I add new entries.
Cumulative yield: running total of profit divided by running total of stakes wagered, expressed as a percentage. This column shows whether your overall approach is profitable and how the yield evolves as your sample grows. Anytime TD bets carry a real win probability of 25-40% for primary scorers, so your yield should be evaluated against that reality — a positive yield of 3-8% over 200+ bets indicates genuine edge.
Closing line value per bet: the difference between your bet odds and the closing odds, expressed as a percentage of implied probability. If you bet at 2.80 (implied probability 35.7%) and the line closed at 2.50 (implied probability 40.0%), your CLV is +4.3 percentage points. Consistently positive CLV is the strongest single indicator of skill because it measures your ability to identify value independent of whether any individual bet wins or loses.
Running ROI by prop type: separate yield calculations for anytime TD, first TD, and 2+ TD bets. This breakdown reveals which prop types you analyse most effectively. Most bettors discover that their edge is concentrated in one or two prop types and that they are breakeven or negative in others. That discovery is worth the entire exercise because it tells you where to focus your future activity.
Implied edge: the difference between your estimated true probability at the time of the bet and the implied probability from the odds you bet. This column requires you to record your probability estimate when you place the bet, which adds a few seconds of work but produces the most revealing metric in the entire spreadsheet. If your pre-bet probability estimates are consistently close to the actual outcomes over hundreds of bets, your analytical model is well calibrated. If they are systematically too high or too low, you have identified a specific calibration error to fix.
Weekly and Monthly Review Cadence for TD Prop Results
Data collection without review is storage, not analysis. I maintain a fixed review schedule that turns the spreadsheet into an active tool rather than a passive archive.
Weekly review takes five minutes after the final Sunday and Monday games. I update outcomes, calculate profit and loss for the week, note any bets where my reasoning was clearly wrong (not just unlucky), and check whether any sportsbook consistently offered the best odds. The weekly review is about maintaining data hygiene — catching errors, filling in closing odds I might have missed, and keeping the spreadsheet current.
Monthly review takes thirty minutes on the first day of each month. I calculate monthly yield, compare it to previous months, and examine whether specific prop types or matchup conditions are outperforming or underperforming. I also review my matchup notes from losing bets to identify recurring analytical errors. The monthly review is where process improvements emerge — you might discover that your rushing TD selections have been consistently profitable while your receiving TD picks have been breakeven, which tells you to reallocate your attention and stakes accordingly.
End-of-season review takes two to three hours and is the most valuable session of the year. I calculate full-season yield by prop type, by sportsbook, by matchup condition, and by week of season. I examine whether my CLV has been consistently positive, whether my probability estimates have been well calibrated, and whether my bankroll management held up under actual conditions. The end-of-season review produces a concrete list of three to five specific changes for the following season — changes grounded in data rather than impressions.
Joey Feazel of Caesars Sportsbook has noted how coaching changes and coordinator turnover create performance shifts that markets do not always anticipate. Your tracking spreadsheet captures those shifts in real time, recording which games featured new coordinators, altered schemes, or personnel changes that affected your selections. When the same situational pattern produces winning bets across multiple weeks, you have identified a repeatable edge. When it produces consistent losses, you have identified a blind spot. Both findings are equally valuable, and neither is visible without the tracking infrastructure that makes them apparent. This disciplined approach to self-evaluation connects directly to the sample size awareness that protects you from drawing premature conclusions.
What columns should I include in a TD prop bet tracking spreadsheet?
A comprehensive TD prop tracker should include fourteen fields: date, NFL week, player name, team, opponent, prop type, decimal odds at bet, stake in units, sportsbook, outcome, profit/loss in units, closing odds, matchup note, and red-zone data at time of selection. Calculated columns for cumulative yield, closing line value, and running ROI by prop type transform the raw data into actionable performance metrics.
How often should I review my TD prop betting results?
Maintain three review cadences. Weekly reviews of five minutes to update outcomes and maintain data accuracy. Monthly reviews of thirty minutes to calculate yield trends and identify recurring analytical patterns. An end-of-season review of two to three hours to perform a comprehensive analysis of full-season performance by prop type, sportsbook, and matchup condition, producing specific strategic adjustments for the following season.
Created by the ”nfl td Prop Bets” editorial team.