NFL Player TD Props by Position: Scoring Rates and Frequency
 Available in US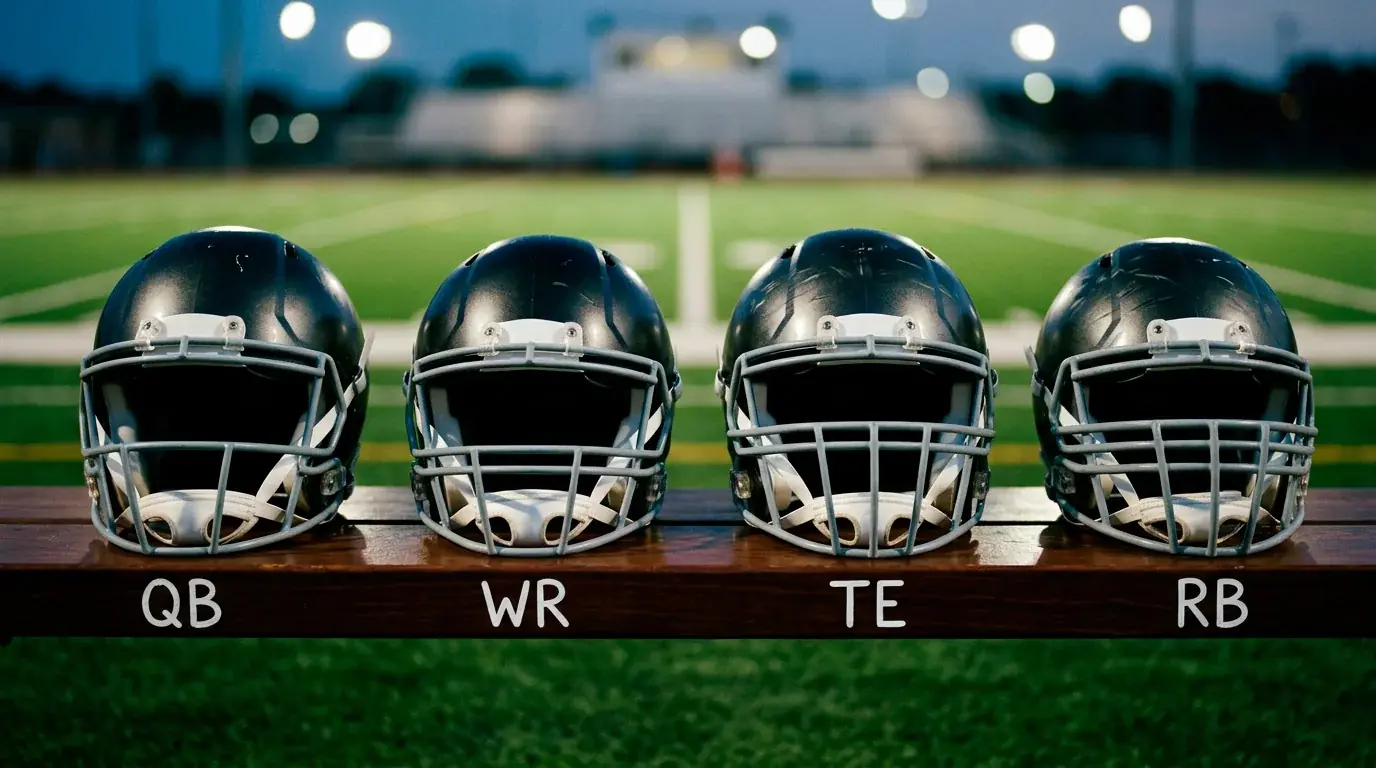
Positional Scoring Rates: Baseline Touchdown Probabilities
I spent my first season of TD prop betting convinced that talent was the primary driver of touchdowns. If a player was good enough, he would score. Three years of data later, I can say with confidence that position and role determine touchdown probability far more than raw ability. A mediocre running back with a monopoly on goal-line carries will outscore a brilliant wide receiver who cedes red-zone targets to his tight end. Position is not destiny, but it is the starting point for every realistic probability estimate.
The NFL’s scoring distribution splits roughly 65% receiving touchdowns and 45% rushing touchdowns in recent seasons — the numbers exceed 100% because some games produce both types. That split tells you immediately that receiving touchdowns are the larger pool of outcomes. But within each category, the per-player distribution is radically different. Running backs score more touchdowns per capita than receivers because there are fewer running backs sharing the goal-line work, while receiver touchdowns are spread across a wider pool of targets.
Running Backs: The Highest Per-Game TD Rate
Running backs with primary roles score touchdowns at the highest per-game rate of any position in the NFL. Jonathan Taylor led the league with 20 touchdowns in the 2025 season, and the top fifteen running backs by touchdown count all averaged more than 0.5 touchdowns per game played. That baseline rate — roughly one touchdown every two games for elite backs — makes running back anytime TD props the most mathematically accessible market for consistent betting.
The key distinction within the position is goal-line role. A lead running back who handles 70% of his team’s inside-the-five carries operates in a fundamentally different TD probability tier than a change-of-pace back who enters the game on third downs and passing situations. The first player’s TD probability is driven by volume in the highest-conversion zone on the field. The second player’s TD probability depends on big plays or passing touchdowns, which are less frequent and less predictable.
Committee backfields compress the per-player rate. When two backs split goal-line work evenly, each one’s per-game TD expectation drops by roughly 40-50% compared to a clear lead back. The market often prices committee backs based on their overall offensive involvement rather than their specific goal-line share, which creates both overpriced backs who get lots of carries between the twenties but few at the goal line, and underpriced backs who are the designated short-yardage runner but barely show up on the stat sheet otherwise.
Wide Receivers: Volume Leaders in Receiving Touchdowns
Wide receivers as a group account for the most receiving touchdowns in the NFL, but the distribution is steeper than casual bettors assume. The top five receivers by touchdown count in any given season typically score 10-14 touchdowns each, while the median starting receiver scores four to six. That range means the market prices elite receivers’ TD props very differently from mid-tier receivers — and the mid-tier is where I have found the most consistent value.
Red-zone target share is the definitive metric for receiver TD probability. A WR1 who commands 30% of his team’s red-zone targets on a team that generates six red-zone possessions per game has roughly 1.8 expected red-zone targets per game. At a typical red-zone target-to-TD conversion rate of 15-20%, that translates to a per-game TD probability of 27-36% — squarely in the range where anytime TD props can be profitable at the right price.
Slot receivers are an interesting sub-category. They tend to score touchdowns on short routes in congested areas — slants, quick outs, and option routes inside the end zone. Their TD probability is less matchup-dependent than outside receivers because they face zone coverage schemes more often than man-to-man shadow coverage. A slot receiver with consistent red-zone usage offers a more stable baseline probability than an outside receiver whose production swings based on the specific cornerback he faces each week.
Tight Ends and Quarterbacks: Niche TD Prop Opportunities
Tight ends occupy a peculiar space in the TD prop market. The position as a whole scores fewer touchdowns than running backs or wide receivers, but the top two or three tight ends in any season produce touchdown rates that rival elite receivers. The gap between the elite tight ends and the rest of the position is enormous — the top tight end might score ten touchdowns while the fifteenth-ranked tight end scores two.
What makes tight end TD props interesting is the pricing. Because the position’s overall reputation is “low touchdown producer,” sportsbooks tend to set tight end TD odds longer than the actual data warrants for the elite few. A tight end who functions as his team’s primary red-zone target — catching passes over linebackers in the seam, running corner routes against safeties — has a TD profile closer to a WR1 than to the average tight end. But his odds often reflect the positional average rather than his individual role.
Quarterbacks are the most position-dependent TD prop market in the NFL. Passing touchdowns do not count for a QB’s anytime TD prop — only rushing touchdowns qualify. That restriction eliminates the primary scoring method for most quarterbacks and makes TD probability almost entirely a function of rushing volume and designed QB runs near the goal line.
Mobile quarterbacks who run designed run-pass option plays and QB power schemes near the goal line score rushing touchdowns at rates that make their TD props genuinely interesting. Some dual-threat quarterbacks average six to ten rushing touchdowns per season, producing per-game TD probabilities of 35-60% — among the highest of any player in the league. The catch is that these rates are concentrated among a small subset of QBs. Pocket passers with limited mobility might rush for one or two touchdowns all season, making their anytime TD odds wildly overpriced at any odds shorter than 10/1.
My practical rule for QB TD props is straightforward: if the quarterback does not have at least five rushing touchdowns through the first eight weeks of the season, I do not bet his anytime TD prop for the remainder of the year. Below that threshold, the per-game rushing TD rate is too low to justify any odds the sportsbook is likely to offer. Above it, the data supports genuine analysis of his anytime touchdown scorer probability based on designed rushing plays and red-zone scramble tendencies.
Which NFL position scores the most touchdowns per game on average?
Running backs with primary goal-line roles score touchdowns at the highest per-game rate, with elite backs averaging roughly 0.5 to 0.8 touchdowns per game over a full season. Wide receivers as a group score the most total touchdowns, but the per-player rate is lower because receiving touchdowns are distributed across more players. Tight ends and quarterbacks have the lowest positional averages.
Are tight end TD props undervalued compared to wide receiver TD props?
For the top two or three tight ends in any season, yes. Elite tight ends who serve as primary red-zone targets produce TD rates comparable to WR1s, but their odds often reflect the lower positional average rather than their individual role. Below that elite tier, tight end TD props are generally priced accurately or even overpriced because the remaining tight ends score infrequently enough that their odds correctly reflect low probability.
Published by the nfl td Prop Bets team.