NFL TD Prop Odds Comparison: Finding Best UK Prices
 Available in US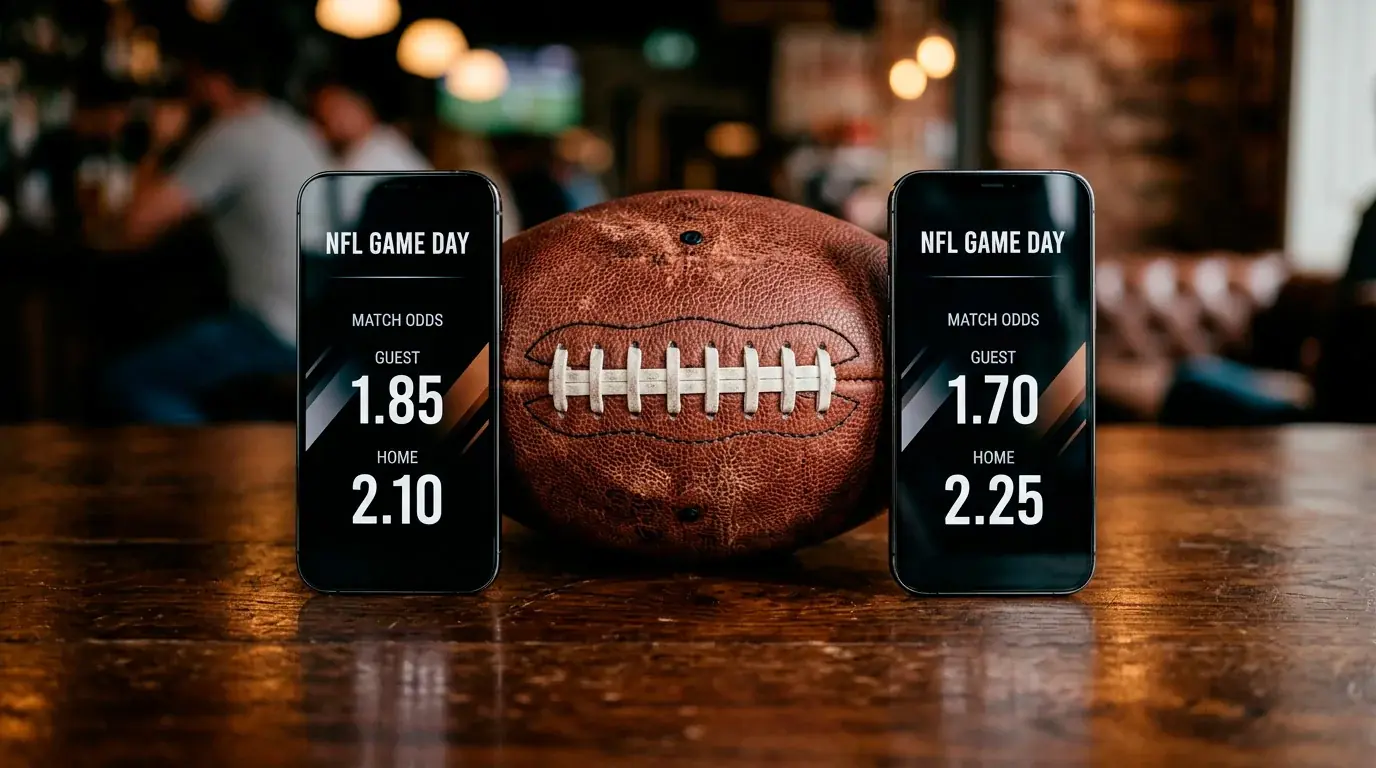
Odds Comparison: Compounding Margin Differences at UK Sportsbooks
I placed the same anytime TD bet on the same player at two different sportsbooks during a Monday night game in 2021. One paid me at 2.50, the other at 2.75. Same player, same game, same outcome — but a 10% price difference on the return. Over one bet, the difference was barely noticeable. Over a full season of two hundred bets, that kind of gap separates profit from breakeven.
The UK online gambling market had roughly 13.5 million average monthly active accounts in Q4 of the 2024-25 reporting period. That is a massive user base being served by dozens of operators, each running their own pricing models, margin structures, and liability management strategies. The competition between those operators is what creates the price variation that disciplined bettors exploit. Two sportsbooks looking at the same running back’s TD probability can reach different conclusions based on their models, their exposure, and how much margin they build into each market.
Understanding Bookmaker Margins on TD Prop Markets
Every sportsbook builds a margin into their odds — the mathematical edge that ensures long-term profitability regardless of individual outcomes. On primary NFL markets like spreads and totals, competitive UK operators run margins of 3-5%. On TD prop markets, margins are wider, typically 5-10%, because sportsbooks invest less pricing attention in player props than in headline markets.
Sportsbooks dedicate far more resources to setting accurate spreads and totals than to pricing individual player props. That resource gap, identified consistently by industry analysts, means TD prop odds contain more noise and more opportunity than tightly priced markets. The wider margin is the cost of that opportunity — you are paying a higher tax on each bet, which makes finding the best available price even more important.
To calculate the margin on a specific TD prop, convert both outcomes (scores a TD and does not score a TD) to implied probabilities and add them. If the “yes” side implies 42% and the “no” side implies 63%, the total is 105%, and the margin is 5%. An operator quoting 42% and 66% has an 8% margin — materially worse for the bettor. Over hundreds of bets, the 3% margin difference between those two operators represents a significant chunk of your potential profit.
A Practical Method for Comparing TD Prop Odds Weekly
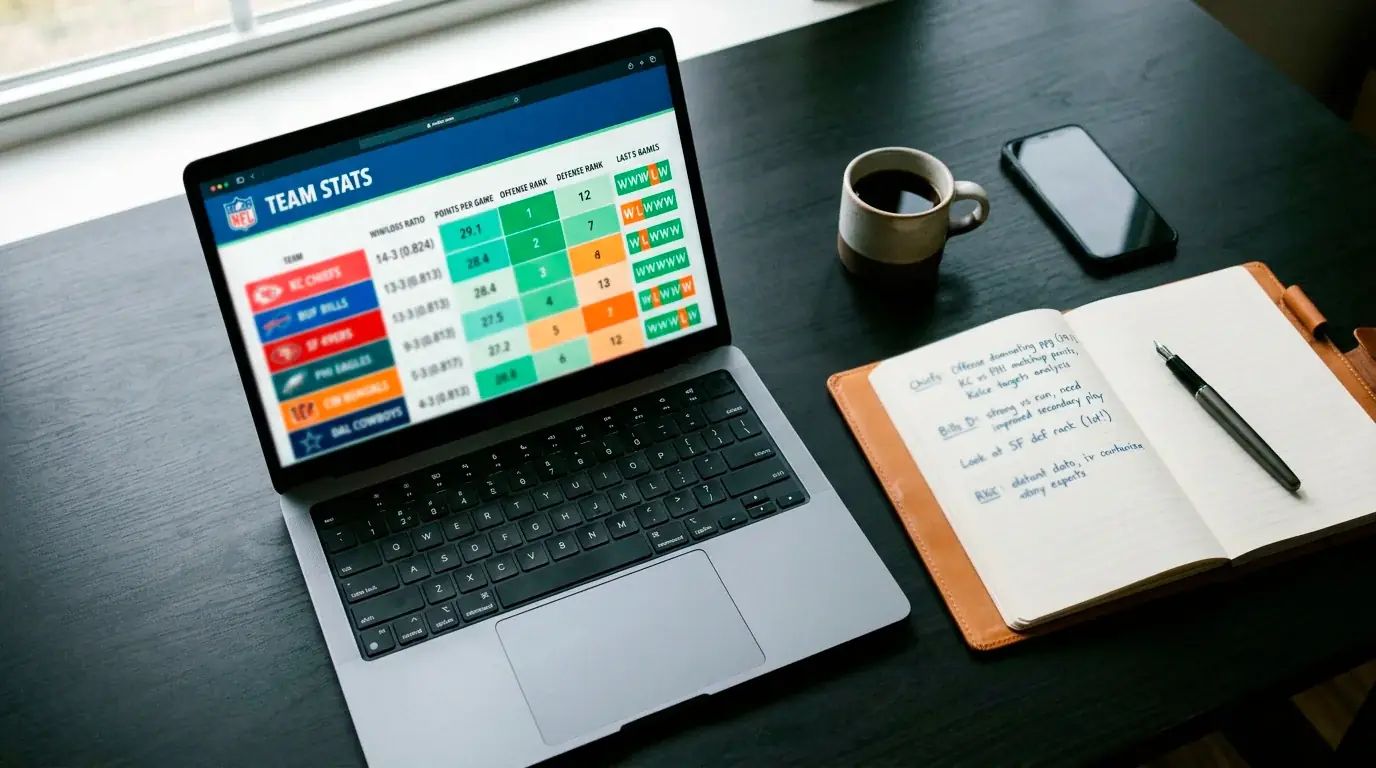
My comparison process takes roughly fifteen minutes per week and runs on a simple spreadsheet. Every Tuesday evening when TD prop lines open, I record the anytime TD odds for my shortlisted players at three to four UK sportsbooks. I convert all odds to decimal format for easy comparison, then highlight the best available price for each player.
The comparison reveals patterns that persist across weeks. Some operators consistently offer sharper prices on running back TD props. Others are more competitive on receiver markets. A few offer the best value on less popular props like tight end or quarterback TDs because they attract less volume on those markets and apply smaller liability-driven adjustments.
I also track how prices move relative to each other. If one operator’s odds shorten faster than others over the course of the week, that operator is absorbing more public money, which means their closing prices are more distorted by recreational action. The operator whose prices move least between Tuesday and Sunday is typically the one most driven by model pricing rather than liability management — and their closing prices tend to be the most accurate reflection of true probability.
One practical constraint: not all UK sportsbooks offer the same depth of NFL TD prop coverage. Some operators list anytime TD odds for every skill player on the roster, while others only price the top ten to fifteen players per game. Your comparison is only useful across operators that actually offer the prop you want to bet. There is no point recording a price that does not exist.
Timing matters in the comparison process. Tuesday and Wednesday prices reflect the sportsbook’s opening model, which is typically the sharpest but also the most volatile. By Friday, injury news and public money have pushed prices in different directions at different operators, widening the gap between the best and worst available odds on the same player. I have found the optimal window for locking in the best price is usually Thursday afternoon — after injury designations have started to clarify but before weekend public money compresses the most popular players’ odds.
The compounding effect of consistent odds comparison is significant over a full season. A bettor placing 200 TD prop bets per season who captures an average of 5% better odds through comparison generates roughly ten additional units of value compared to someone using a single sportsbook. That margin is the difference between a marginally profitable season and a meaningfully profitable one, and it requires no improvement in analytical skill — only the discipline to check multiple prices before committing your stake.
Free Tools and Resources for Odds Comparison in the UK
Several free websites aggregate odds from multiple UK sportsbooks and display them side by side. These tools save time compared to manually checking each operator’s app, but they come with a caveat: the odds displayed are not always updated in real time. A five-minute lag between the aggregator’s display and the sportsbook’s actual current odds can mean the “best price” shown is no longer available when you click through to place the bet.
I use aggregators as a starting point, not a final answer. They tell me which operators are likely to have the best price for a specific TD prop, and then I verify the actual current odds at the sportsbook before betting. This two-step approach captures most of the time savings from aggregation while avoiding the frustration of stale prices.
Line-tracking tools that record historical odds movement are more valuable than snapshot comparison tools for serious TD prop analysis. Seeing how a player’s odds evolved from opening to closing over the past several weeks reveals which operators tend to open with sharper lines and which tend to offer the best prices late in the week. That pattern recognition, combined with the weekly comparison routine, compounds into meaningful value across an eighteen-week season.
Building the comparison habit is more important than finding the perfect tool. Even checking two sportsbooks rather than one improves your average price. Checking three is better still. The marginal benefit of adding a fourth or fifth operator to your comparison diminishes, but the first step — from one to two — delivers the largest improvement. If you are currently placing all your TD prop bets at a single sportsbook without checking alternatives, adopting this approach to odds comparison across formats is the single easiest way to improve your long-term results.
Do UK sportsbooks offer different TD prop odds than US-facing operators?
Yes. UK sportsbooks price TD props using different models, margin structures, and odds formats than US-facing operators. The underlying player probability is the same, but the margin applied and the liability-driven adjustments vary. UK operators also default to fractional odds, while US operators use American odds, which can obscure direct price comparisons without conversion.
Is it worth having accounts at multiple sportsbooks for TD prop betting?
Absolutely. Price differences of 5-15% on the same TD prop are common across UK operators. Over a full NFL season of regular betting, consistently taking the best available price rather than a single operator’s price adds several units of value. Three accounts is a practical minimum for meaningful comparison. The setup time is a one-off investment that pays dividends every week.
Written by the editors at nfl td Prop Bets.