NFL TD Prop Research Tools: Free Data and Analytics Sources
 Available in US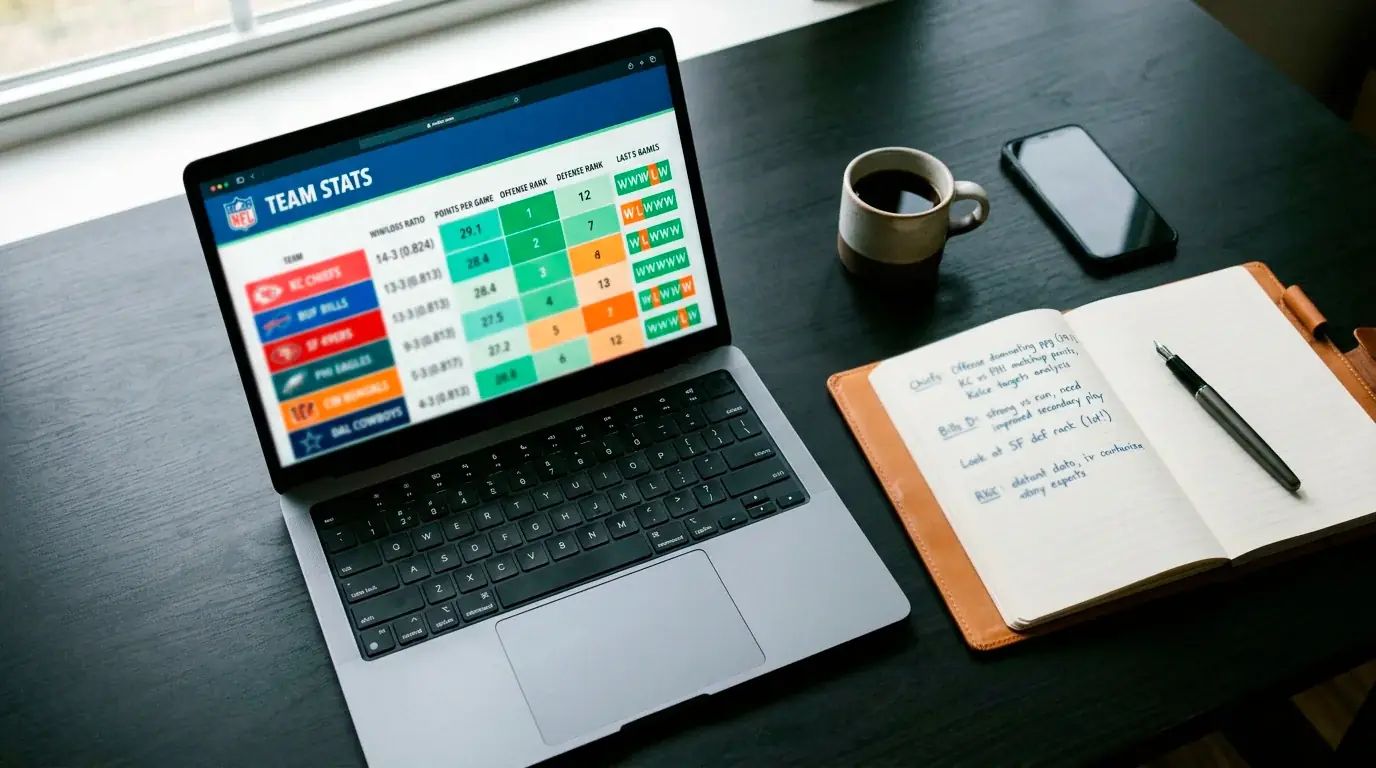
Free Analytics Sources: Gathering Accurate TD Prop Data
During my first season of serious TD prop analysis, I paid for three different subscription analytics platforms. By the end of the year, I had cancelled two of them because the free alternatives provided the same core data I actually used. The paid tools offered prettier dashboards and more exotic metrics, but the foundational information — red-zone usage, goal-line carry shares, defensive TD rates — was available without spending a penny.
Sportsbooks spend far more resources setting accurate spreads and totals than they do pricing player props. That structural underinvestment creates opportunity, but exploiting it requires data that most casual bettors never bother to access. The good news is that the NFL’s statistical infrastructure has made the critical data publicly available. The gap between sharp and recreational TD prop bettors is not about who can afford the best tools — it is about who actually uses the free resources that exist.
Statistical Platforms for Red-Zone and Scoring Data
Red-zone usage data — 77.2% of NFL touchdowns in 2024 came from red-zone possessions — is the backbone of TD prop analysis. The platforms that provide this data fall into two categories: official NFL statistical feeds and independent analytics sites that process play-by-play data into usable formats.
The NFL’s own statistical site publishes team-level and player-level data that includes red-zone statistics, scoring leaders, and basic performance splits. The interface is not designed for quick analytical work, but the underlying data is comprehensive and free. I use it primarily for verifying numbers I see on third-party platforms — if two sources disagree on a player’s red-zone target count, the official NFL data is the tiebreaker.
Independent analytics platforms built on the NFL’s play-by-play feed offer more granular breakdowns. Several provide field-zone splits (carries and targets inside the twenty, inside the ten, and inside the five), red-zone target shares by player, and goal-line usage trends. These platforms update within twenty-four hours of each game, which means the data is fresh enough for Tuesday analysis when the next week’s prop lines open.
Advanced analytics sites that publish expected points added, win probability, and efficiency metrics are useful for contextual analysis but less directly applicable to TD prop betting than raw red-zone usage data. I check them occasionally for game-script projections and pace-of-play metrics, but they are secondary tools rather than primary ones. The primary data you need — who gets the ball near the goal line and how often — does not require advanced modelling to be actionable.
Defensive data is an often-overlooked category within the free analytics ecosystem. Team-level defensive red-zone TD rates — the Philadelphia Eagles led the NFL at 70.97% red-zone TD conversion in the 2025 season while the Denver Broncos allowed just a 42.6% TD rate to opponents — are available on the same platforms that provide offensive data. Cross-referencing offensive player usage with the opposing defence’s red-zone vulnerability is a straightforward analytical step that most casual bettors skip entirely, and the data to perform it is free.
Odds Comparison and Line Tracking Tools Available in the UK
The UK’s mature regulated betting market supports a robust ecosystem of odds comparison sites. Several aggregators pull real-time odds from licensed UK operators and display them side by side, allowing you to identify the best available price for any TD prop in seconds rather than manually checking each sportsbook’s app.
Line-tracking tools that record historical odds movement are more valuable for analytical purposes than snapshot comparison tools. A tool that shows you how a player’s TD odds moved from opening to closing over the past five weeks reveals patterns in which operators consistently open with sharper lines, which ones attract the most public money, and which ones adjust most aggressively to injury news. That historical context turns odds comparison from a one-time price check into an ongoing analytical input.
The UK market, with 13.5 million average monthly active online gambling accounts, generates enough volume that multiple operators offer competitive NFL prop coverage. Not all comparison tools cover every operator, though. The most comprehensive aggregators track eight to twelve licensed UK sportsbooks, while others cover only the largest five or six. For TD prop purposes, coverage of at least four operators with strong NFL prop markets gives you enough price diversity to capture meaningful value.
Building a Research Workflow from These Resources
Tools without a workflow produce information without action. The research process I have refined over seven seasons follows a fixed weekly sequence that turns raw data into bet decisions in under ninety minutes.
Tuesday: pull four-game rolling red-zone data from my primary analytics platform. Update my spreadsheet with current red-zone target shares, goal-line carry shares, and team-level red-zone TD conversion rates for offences and defences. This step takes thirty minutes and produces the foundation for the week’s analysis.
Wednesday morning: check which TD prop lines have opened at my primary sportsbooks. Cross-reference the opening odds with my red-zone data to identify potential value plays. Record opening odds for candidates in the spreadsheet. This step takes twenty minutes.
Wednesday afternoon: verify odds at two to three additional operators for my top candidates. Calculate implied probabilities and compare them to my estimated true probabilities from the data. Flag any player where the gap exceeds five percentage points. This takes fifteen minutes.
Thursday: check updated injury reports. Adjust any probability estimates affected by new information. Place bets on confirmed candidates at the best available odds. This takes ten to fifteen minutes.
Friday to Saturday: monitor injury developments. If a key player is downgraded to doubtful or ruled out, recalculate redistribution implications for teammates and check whether the beneficiaries’ odds have adjusted fully. Place any late-week bets triggered by injury news.
Sunday: review inactives when published. Execute any pre-planned late adjustments. Watch games, track results, and update the tracking spreadsheet after final scores.
The entire weekly process takes approximately ninety minutes of focused work spread across five days. That is less time than most punters spend browsing social media for tips — and it produces output that is systematically connected to the data rather than dependent on someone else’s opinion. Integrating these tools into a structured workflow is what makes them useful, and the same discipline applies to the broader expected value framework that governs my entire approach.
What is the best free website for NFL red-zone stats?
Several free platforms provide comprehensive NFL red-zone data, including team-level and player-level target shares, carry distributions, and conversion rates. The NFL’s official statistics site is the most authoritative source, while independent analytics platforms built on play-by-play data offer more granular field-zone breakdowns. No single site is definitively the best — I recommend cross-referencing two sources to verify accuracy.
Are there UK-specific tools for NFL prop bet analysis?
Most NFL prop analysis tools are US-based but fully accessible to UK users. UK-specific value comes from odds comparison aggregators that track licensed UK sportsbooks, displaying prices from operators available in the UK market. For statistical analysis, the same platforms used by American bettors provide the red-zone and scoring data that drives TD prop selections, and the data is geographically neutral.
Created by the ”nfl td Prop Bets” editorial team.